

Set it up
1
Install the package
2
Set your token
MCP analytics uses the same project token as the AI traffic tracker. Copy it from the Set your token step on the MCP server tab and add it as
NOTRA_GEO_TOKEN wherever your MCP server runs, and never hardcode or commit it.3
Wrap the transport
Wrap the transport your server already creates before you pass it to The tracker buffers events for up to a second and sends them in batches, and on stdio it sends the remaining events when the transport closes. On a serverless runtime, pass
server.connect. This works with stdio, Streamable HTTP, SSE and any other transport that exposes send and onmessage.server.ts
waitUntil to trackMcpTransport or await flushMcpEvents() before the function returns, otherwise the last events can be lost.4
Check the dashboard
Connect an agent to your server and call a tool. The MCP server tab switches from the install steps to the dashboard once Notra stores the first request.
What gets recorded
Every event carries the JSON-RPC method, the tool, resource or prompt name, a status, the latency and the response size. The status isok, tool_error when a tool returns isError, or rpc_error with the JSON-RPC error code and message. Events also record the Mcp-Session-Id (or a per-connection id on stdio) and the client name, server name, versions and protocol version from initialize.
Each tools/list answer stores the tool names and descriptions your server advertised, which is how the dashboard finds tools that no agent calls. Reads of ui:// resources count as renders of an MCP Apps interface. Requests your server sends to the client, such as elicitation/create and sampling/createMessage, are tied to the tool call that triggered them, and elicitations record whether the user accepted, declined or cancelled. Pass relatedRequestId when you call elicitInput so the event knows its tool.
The tracker skips ping by default, and you can pass excludeMethods to choose which methods it skips.
Record more context
Tool arguments and results never leave your server unless you opt in. These options add detail to the dashboard:server.ts
Read the dashboard
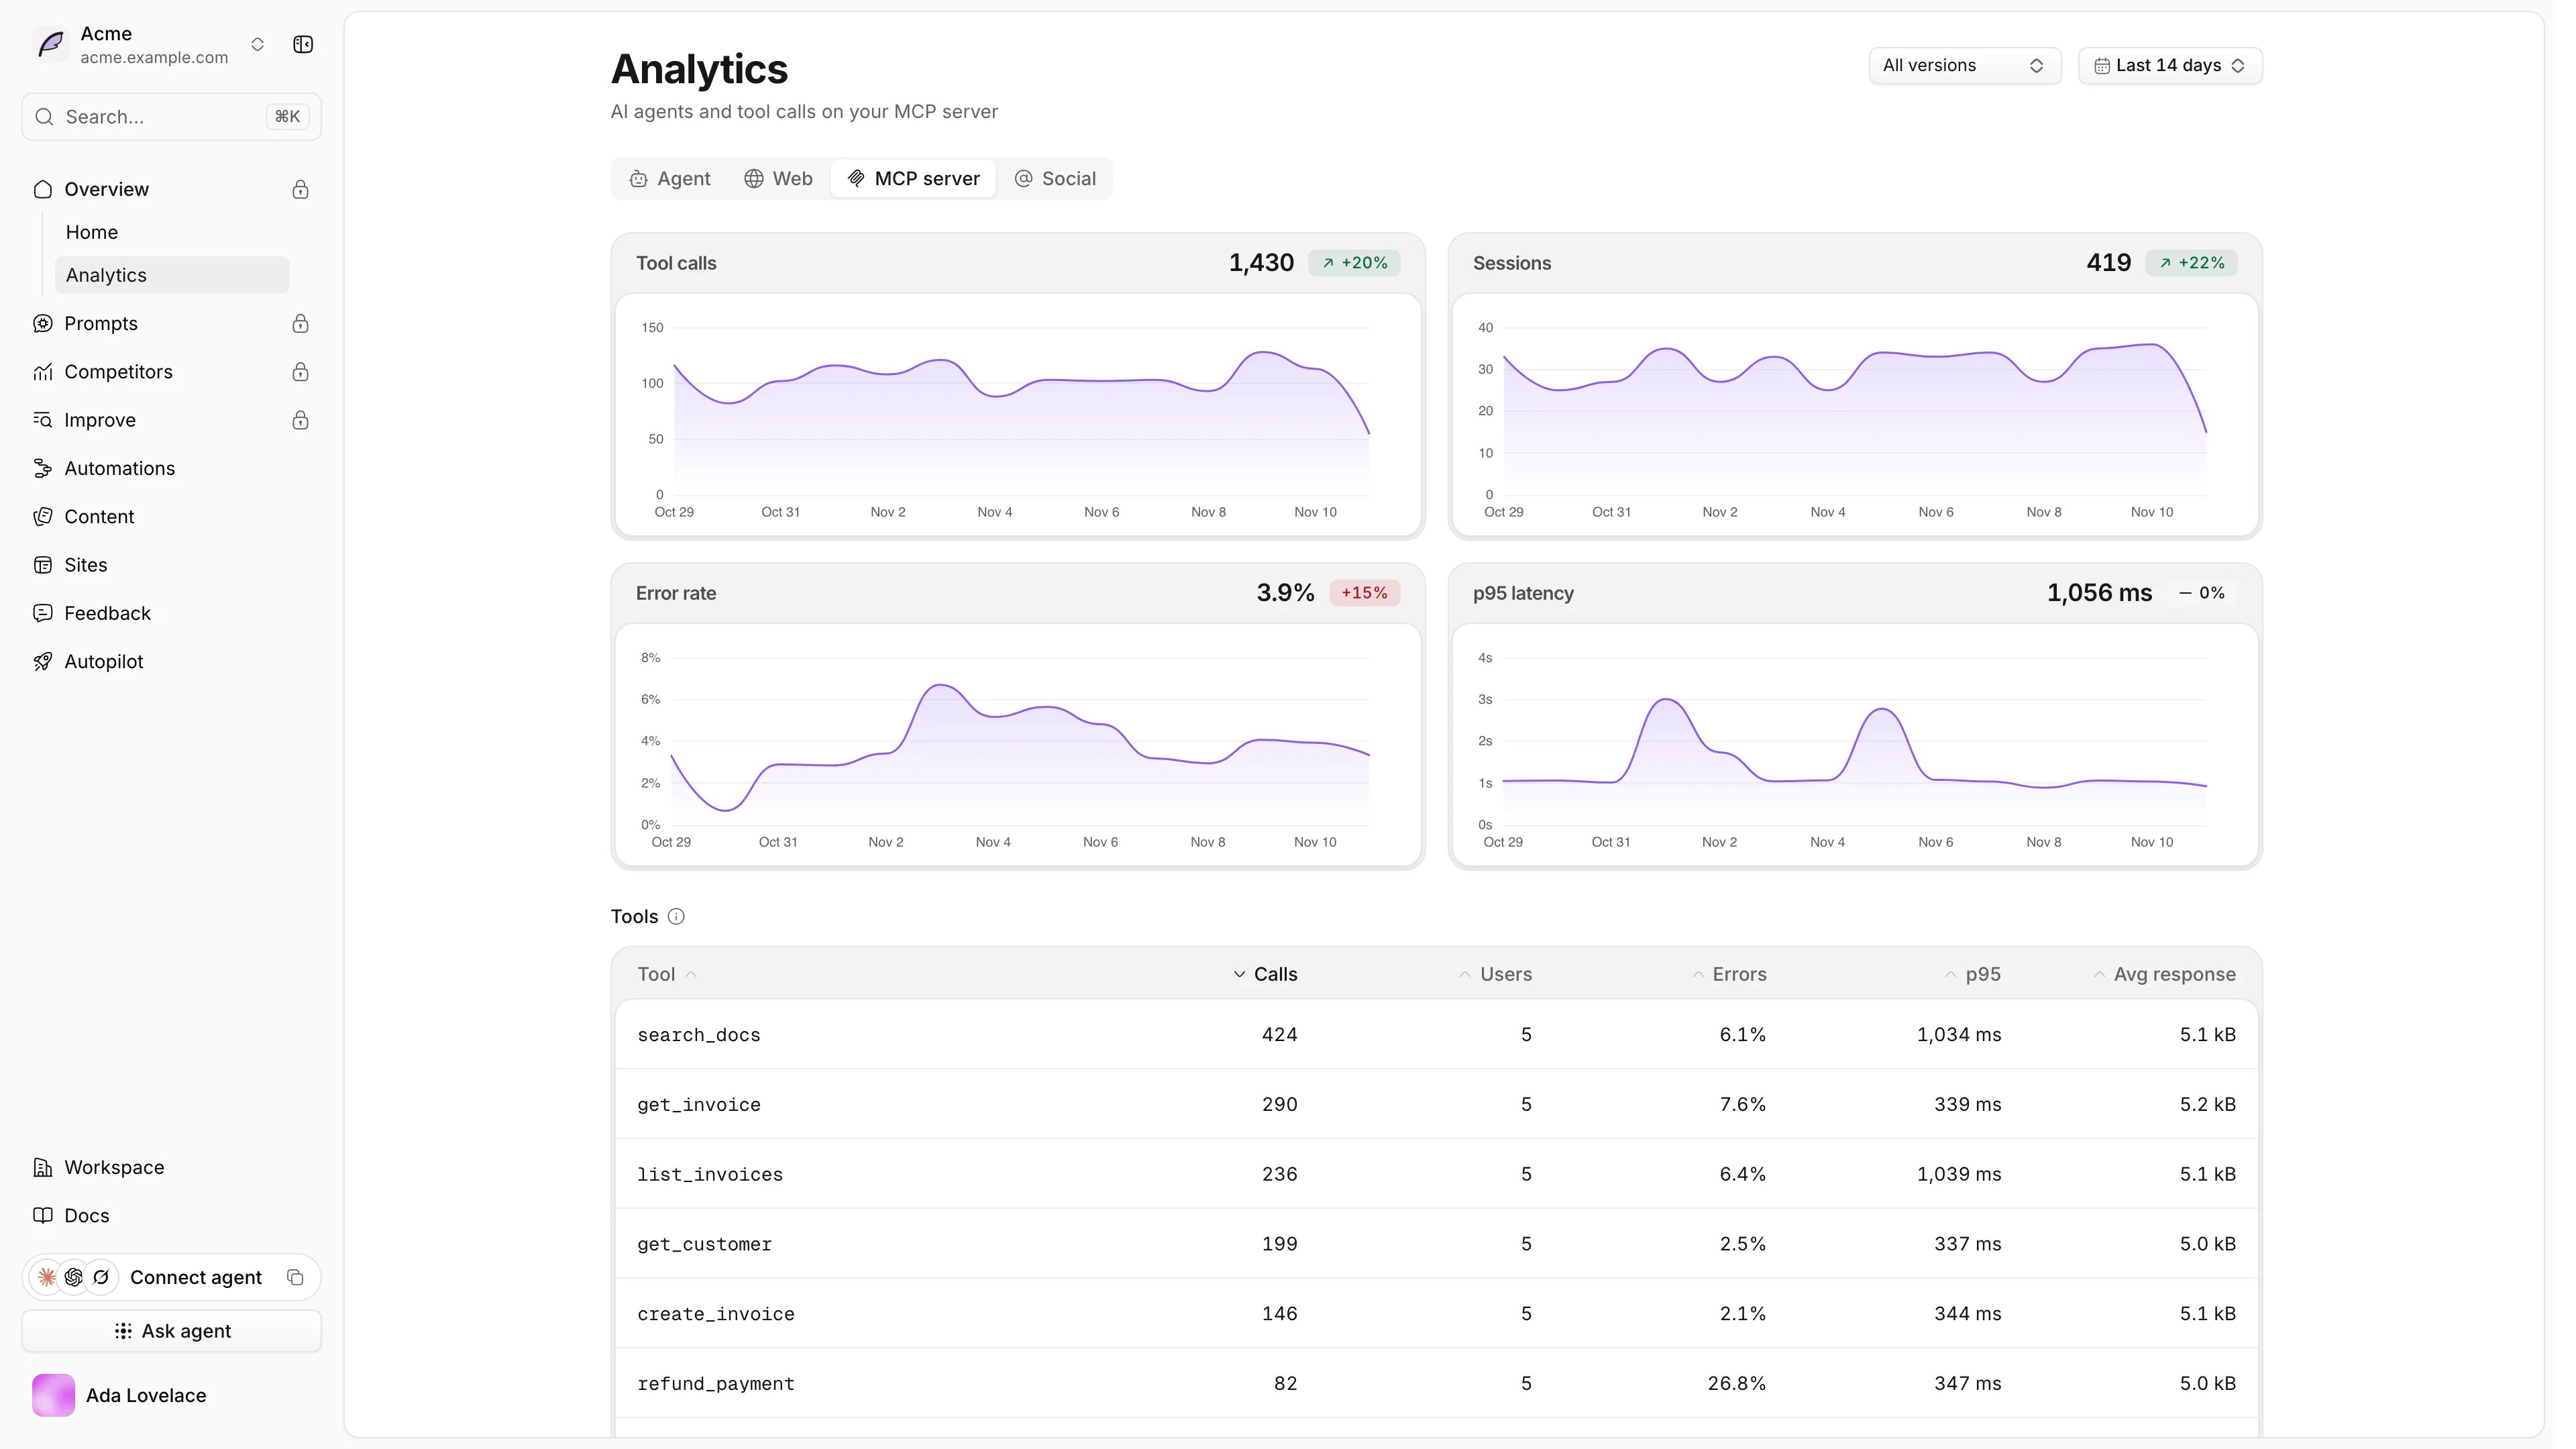
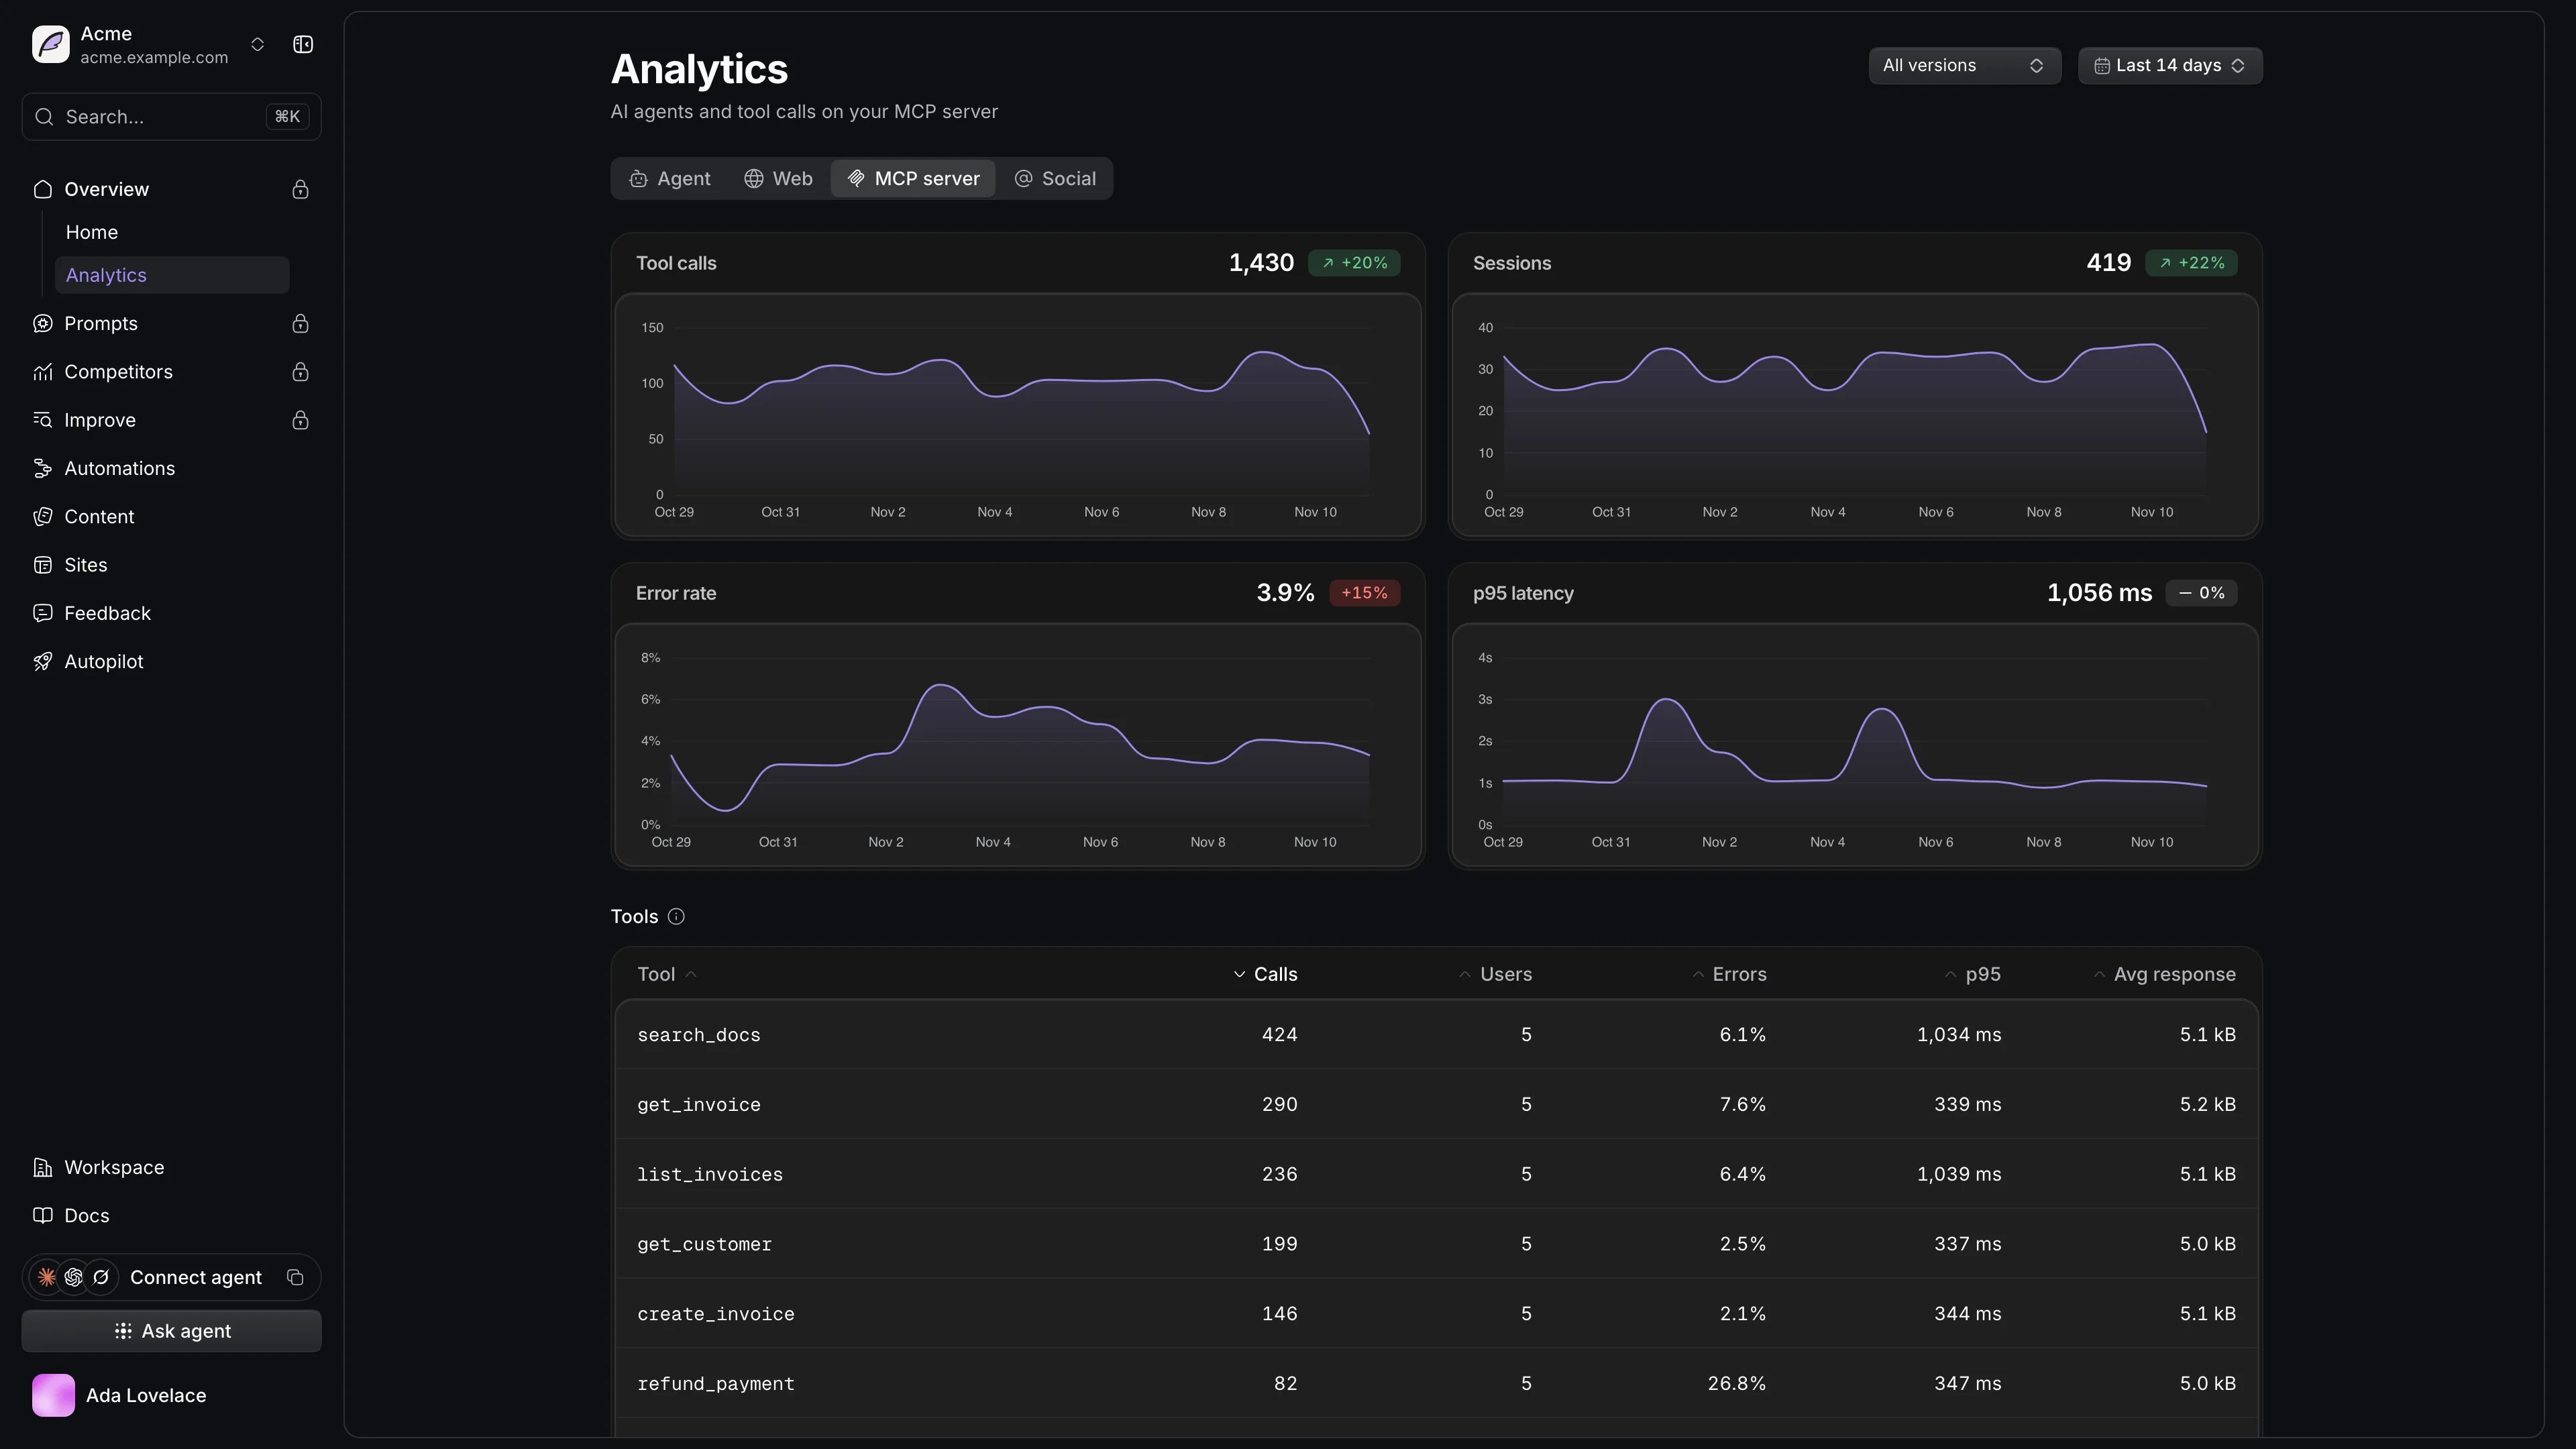
The top of the tab charts tool calls, sessions, error rate and p95 latency for the selected range against the range before it. Use the Server version picker to compare releases of your server.- Tools lists each tool with its calls, users, errors, p95 latency and average response size. Click a tool to see which tools agents call before and after it, how they recover from failures and what they wanted.
- Never called lists tools your latest
tools/listanswer advertised that no agent called in the range. Rename them, improve the description or remove them. - Asking the user groups elicitation and sampling requests by the tool that sent them, with how users answered.
- Interactive UI shows the MCP Apps interfaces hosts loaded and the tools that declare them.
- Clients, Models, Sessions and Users break traffic down by who connected. Click a session to see its full timeline.
- What agents are trying to do lists the most frequent intents and the tool each one routed to.
- Recent requests shows the last 100 requests your server answered. Click one to see its arguments, response and error.